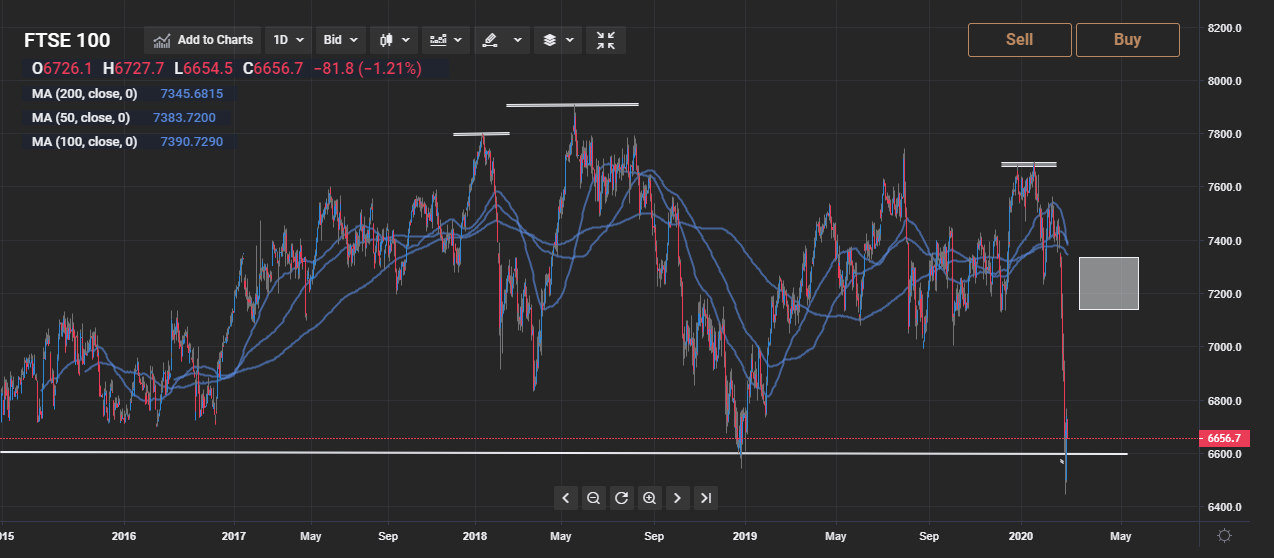
The FTSE 100 suffered its worst weekly sell-off since the 2008 financial crisis last week, as fears over the global spread of the coronavirus gripped financial markets.
UK 100 analysis shows that a breakout below the 6,500 support level could unleash another 1,000 decline in the index.
FTSE 100 medium-term price trend
The FTSE 100 came under intense selling pressure last week, with the index suffering a decline of more than ten percent.
Not even the strong inverse relationship the FTSE 100 shares with the British pound could save the index, as sterling crashed to a new 2020 trading low.

FTSE 100 technical analysis shows that a breakout below the 6,500 support level could cause the index to tumble lower by another 1,000 points.
The daily time frame clearly shows a large head and shoulders pattern with a downside projection of around 1,300 points.
Traders should monitor the neckline of the pattern, around the 6,500 level for further clues, as a bearish break below the support could cause a wave of new bearish bets towards the FTSE 100.
Upward corrections back towards the 7,300 level can still not be ruled out at this stage.
FTSE 100 short-term price trend
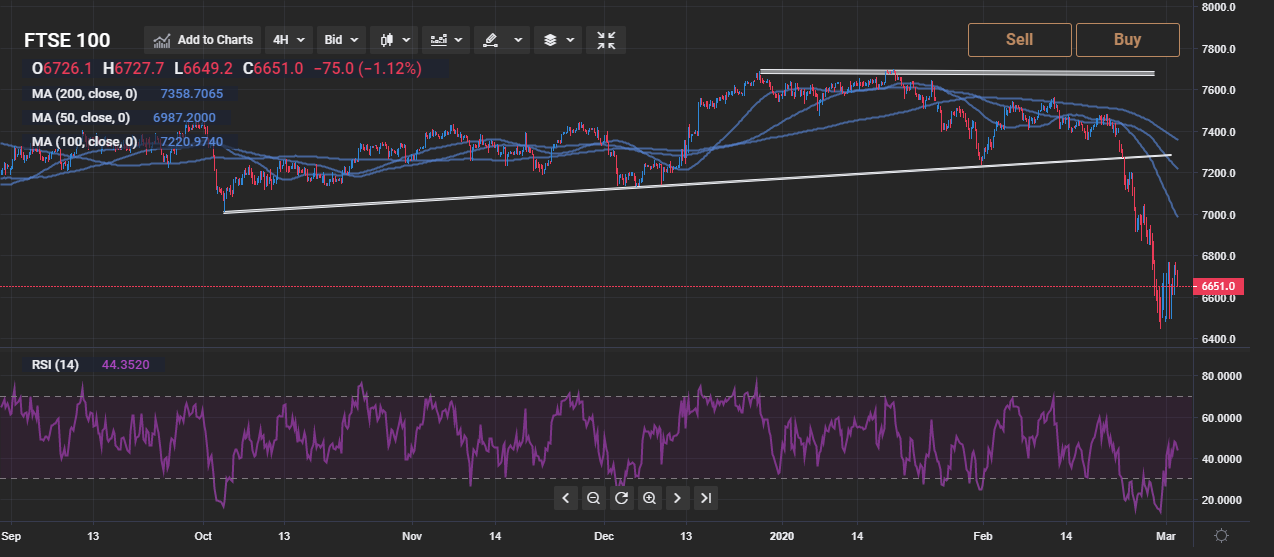
FTSE technical analysis over the short term is showing that bears are in control while the price is trading above the 7,100 level.
Technical indicators on the four-hour time frame, such as the Relative Strength Index and MACD are at their most oversold since October 2018.

Last week’s decline has created substantial amounts of untested demand around the 7,400 level.
At present, it may seem unrealistic that the index can bounce back above the 7,000 level.
Sustained gains above the 6,760 level are needed to build short-term upside buying momentum.
FTSE 100 technical summary
FTSE technical analysis suggests that the index could crash by a further 1,000 points if the 6,500 level is breached. The 4,200 level is the overall downside target of a bearish head and shoulders pattern on the higher time frames.
 Nathan Batchelor


