Why is indices trading important to traders?
A stock market index is a measurement of a compilation of shares, which tracks and assesses the performance of a particular market’s sector, region or country’s economy in general.
The majority of highly developed, as well as developing economies, have at least one financial index. For example, the S&P 500 index includes the stocks of 500 top-traded companies in the United States. Comprising 70% of the overall financial value of the US stock market, the index delivers a good view on the state of the American stock market as a whole.

Why trade indices?
Index trading is a relatively secure form of trading with integrated money management. The risks of trading indices are always lower than the risks of investing in individual stocks.
Indices are the least manipulative financial instruments. The price of an index changes according to the price fluctuations of the constituent companies that make up that index.
Embedded money management scheme. Trading indices, you simply don’t put all your eggs into one basket. With the NASDAQ 100 index, you diversify into the most-prominent American high-tech companies. Choosing CAC 40, you contribute to petrochemical industries.
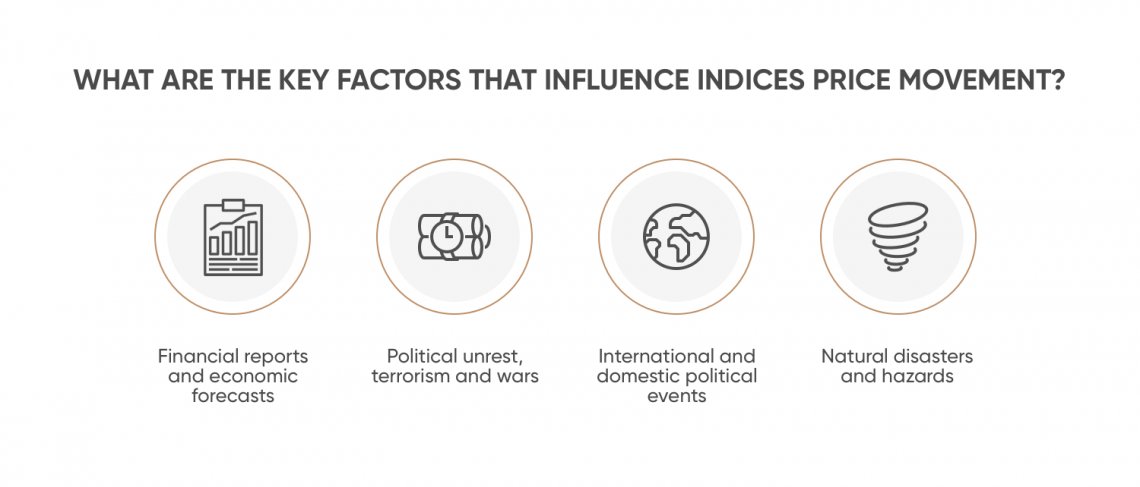
Lower risks. Though indices can also be volatile due to factors like geopolitical events, economic forecasts and natural disasters, an index losing or gaining 10% is already a huge historical event that will often hit the news.
No risk of bankruptcy. Unlike an individual company, an index can’t go bankrupt. If a DAX 30 constituent goes bankrupt, it is replaced by the 31st company in the list of leading German companies. However, if you hold shares in this business, you’ll automatically lose your investment.
Benefit from the global economic situation. By investing in a basket of companies, you benefit from the positive or negative dynamics of the global economy. If one company fails, the index can still rise.
How to trade indices with CFD
Trading indices is a way to gain exposure to global or regional markets without having to analyse the performance of individual companies. Popular stock market indices usually provide traders with a high degree of liquidity, long trading hours and tight spreads.
One of the easiest and most popular ways to trade indices is with CFDs (contracts for difference). A contract for difference (CFD) is a type of contract between a trader and a broker in order to try and profit from the price difference between opening and closing the trade.
Using CFDs to trade indices will allow you to go long or short the market without having to deal with conventional exchanges. You trade direct with your CFD broker. No matter whether you have a positive or negative view of the index forecast and predictions, you can try to profit from either the upward or downward future price movements.
Made up of a wide cross-section of liquid trading instruments, indices are extremely popular with CFD traders around the world.
How are major indices calculated?
Before we stepped into the digital era, indices were calculated as simple averages, i.e. the prices of all the constituents were summed up and divided by the number of companies. Today this approach may seem too simple, but it met the requirements of its time, providing a reliable view on the strength of a particular market.
Today indices' values still change according to the fluctuations in the value of its underlying individual stocks. However, indices use the two major formulas to determine their price:
Market-value-weighted indices
Market-weighted, also known as capitalisation-weighted, indices are calculated based on the total market value (capitalisation) of its constituents. It means that the bigger companies have a larger impact on the index. Examples of market-weighted indices are FTSE 100 and DAX 30.Price-weighted indices
Price-weighted indices are calculated based on the share price of its constituents. It means that companies with higher share prices have a stronger impact on the overall index price. An example of a price-weighted index is the Dow Jones Industrial Average.
Why trade indices CFDs with Capital.com?
Advanced AI technology at its core: A Facebook-like news feed provides users with personalised and unique content depending on their preferences. If a trader makes decisions based on biases, the innovative News Feed offers a range of materials to put him back on the right track. The neural network analyses in-app behaviour and recommends videos and articles to help polish your investment strategy. This hopefully helps you refine your approach when you trade the world’s most popular stock market indices.
Trading on margin: Providing trading on margin (20:1 for major indices), Capital.com gives you access to the NASDAQ 100, DAX 30, FTSE 100, Dow Jones 30, S&P 500, CAC 40, Hang Seng 50, ASX 200, Euro Stoxx 50 and many more indices with the help of CFDs.
Trading the difference: By trading CFDs on indices, you don’t buy the underlying asset itself, meaning you are not tied to it. You only speculate on the rise or fall of its price. CFD trading is no different from traditional trading in terms of its associated strategies. A CFD investor can go short or long, set stop and limit orders and apply trading scenarios that align with his or her objectives.
All-round trading analysis: The browser-based platform allows traders to shape their own market analysis and forecasts with sleek technical indicators. Capital.com provides live market updates and various chart formats, available on desktop, iOS, and Android.
Focus on safety: Captal.com puts a special emphasis on safety. Licensed by the FCA and CySEC, it complies with all regulations and ensures that its clients’ data security comes first. The company allows to withdraw money 24/7 and keeps traders’ funds across segregated bank accounts.
What are the world’s top-traded indices?
There are plenty of indices, which concentrate on certain market sectors and stocks. The world’s famous Dow Jones Industrial Average includes the stocks of the 30 major players in particular industries.
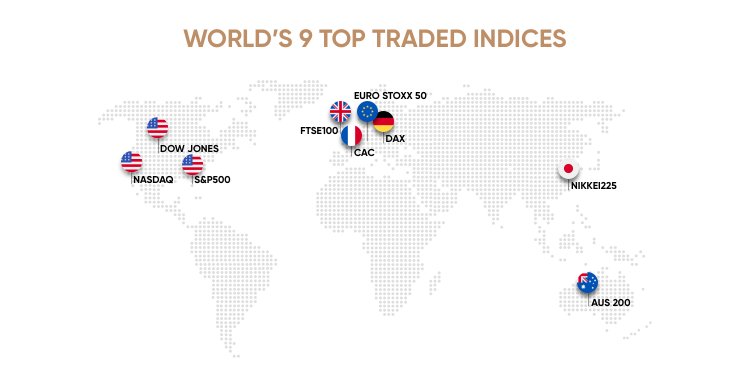
Some of the world’s most popular indices are: S&P 500 and NASDAQ 100 (New York), FTSE 100 (London) and DAX 30 (Frankfurt), AUS 200 (Sydney) and Nikkei 225 (Tokyo), CAC 40 (Paris) and Euro Stoxx 50.

Generally, there are three common types of indices – global, regional and national.
| Type of Index | Description | Leading Indices |
|---|---|---|
Global stock market indices | Tracks equities from all over the world. For example, the MSCI World index comprises large and mid-cap equities from 23 developed countries | MSCI World Index S&P Global 100 FTSE All-World Index S&P Global 1200 Dow Jones Global Titans 50 Russell Global Index |
Regional stock market indices | Tracks equities of certain regions. These indices may reflect European, Latin American, Asian equities, etc. | Asia:
Latin America:
Europe:
|
National stock market indices | Tracks equities of individual countries. The top 10 national indices include the following: | China: SSE Composite Index Japan: Nikkei 225 Germany: DAX30 United Kingdom: FTSE 100 France: CAC40 Index India: Bombay stock market Index Italy: FTSE MIB Index Brazil: Bovespa Stock Index Canada: S&P TSX 60 Index South Korea: KOSPI Index |
Index trading historical data
The very first stock market index was developed and launched in 1885 in the United States. The Wall Street Journal editor and the co-founder of Dow Jones & Company – Charles Dow – started counting the average change in the market prices for the 11 top industrial companies of that time. Since 1928, the Dow Jones index has been calculated as an index of 30 notorious companies on the US stock market.
Read our other Trading Guides:
Most traded
| US100 US Tech 100 | - +1.600% | Trade |
| US30 USA 30 | - +1.590% | Trade |
| DE30 Germany 30 | - +1.250% | Trade |
| UK100 UK 100 | - +1.450% | Trade |
| US500 USA 500 | - +1.440% | Trade |


