Vix analysis shows that market volatility spiked to its highest level in over two years as investors woke up to the fact that the coronavirus could have a huge impact on the global economy.
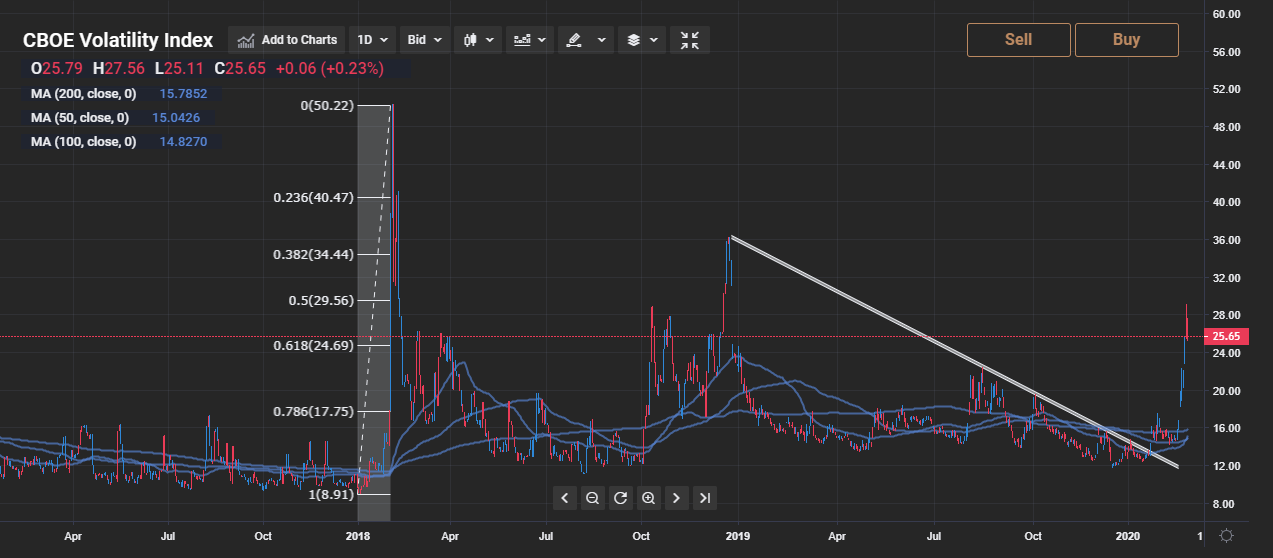
Going forward, a breakout above the 29.56 resistance level could see the VIX moving significantly higher over recent weeks and months.
Vix medium-term price trend
The CBOE volatility index, otherwise known as the VIX, spiked to its highest level since January 2018 last week, as financial markets crashed over coronavirus fears.
Vix technical analysis shows that market volatility could start to move towards the 34.00 and possibly the 40.50 level if the 29.56 level is surpassed.

The daily chart shows that the VIX moved within touching distance of the 50 percent Fibonacci retracement level of the index’s all-time high to all-time low last week.
Trendline analysis on the mentioned time frame shows that the 23.00 level is another pivotal medium-term level in the VIX.
Over the medium-term, the VIX could move lower while capped by the 28.00 level, but could move much higher if the 50 percent Fibonacci level is breached.
Vix short-term price trend
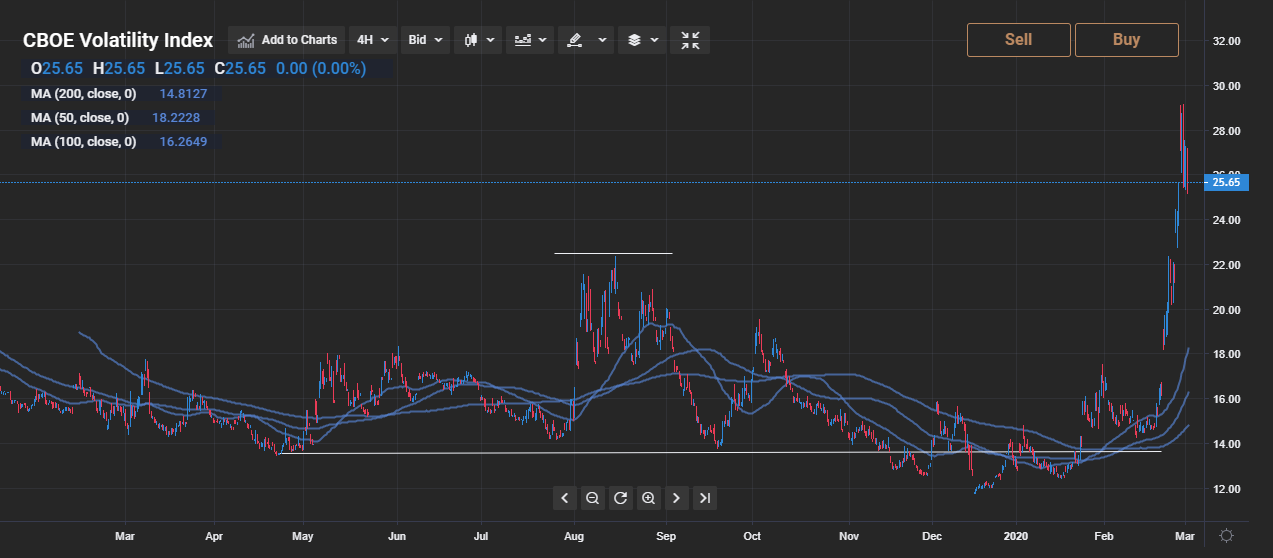
Vix analysis highlights that the short-term bullish trend in index will remain intact while price trades above the 23.00 level.
The recent spike in the VIX also invalidated a bearish head and shoulders pattern on the lower time frames.

Looking at the size of the pattern, it is indicating that the VIX could move towards the 34.00 level over the coming days and weeks.
Traders should be mindful that the VIX is now at its most overbought level since 2018, hinting that downside correction may be coming.
VIX technical summary
Vix analysis shows that market volatility moved sharply higher last week, with the 34.00, and 40.50 levels the next major upside targets.
 Nathan Batchelor


